Network Science Notes
This note is a personal synthesis of network science, graph mining, epidemic modeling, and multi-agent systems references. I have not attached a specific university course code to this version because the source notes did not identify one.
Central Question
Network science asks: when does the pattern of relationships matter as much as the attributes of the individual objects?
A flat feature table treats objects as independent rows. A network treats relationships as first-class data:
\[G=(V,E), \qquad A_{ij}=1 \text{ if } i \text{ connects to } j.\]That shift changes the questions. Instead of only asking what a node is, we ask where it sits, what paths pass through it, which communities constrain it, and how dynamics propagate through topology.
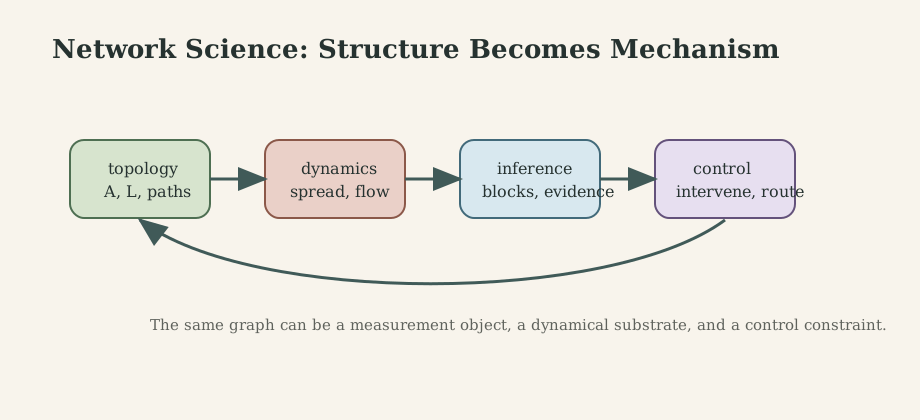
1. Topology and Dynamics Are Coupled
For a dynamical process on a graph, node states often evolve as
\[\dot z_i=f_i(z_i)+\sum_j A_{ij}g_{ij}(z_i,z_j).\]The adjacency matrix is therefore not a passive data structure. It controls who can influence whom, how fast information travels, which failures cascade, and where interventions have leverage.
Common structural quantities include degree, paths, components, clustering coefficient, assortativity, centrality, and graph Laplacian eigenvalues. The right metric depends on the process:
- routing cares about shortest paths and betweenness,
- diffusion cares about spectral radius and communities,
- consensus cares about Laplacian connectivity,
- recommendation and ranking care about random walks.
2. Propagation and Epidemic Thresholds
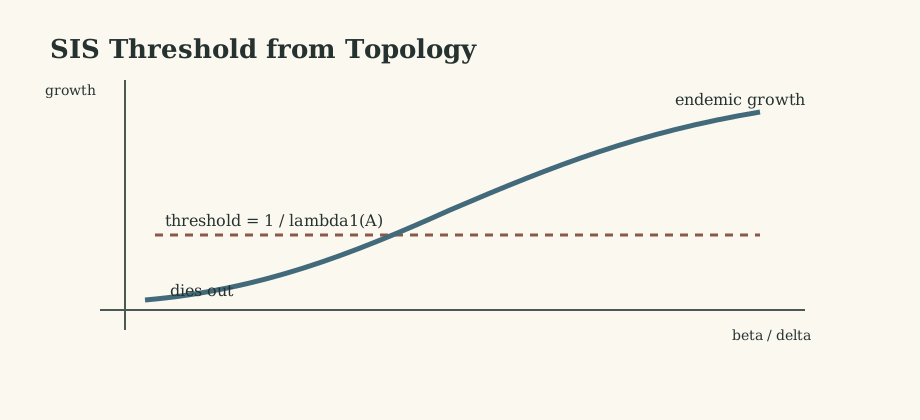
For SIS spreading on graph $A$, a mean-field form is
\[\dot p_i=-\delta p_i+\beta(1-p_i)\sum_jA_{ij}p_j.\]Linearizing near the disease-free state gives
\[\dot p\approx(\beta A-\delta I)p.\]The disease-free state becomes unstable when
\[\frac{\beta}{\delta}>\frac{1}{\lambda_1(A)}.\]This explains why hub-heavy networks can be fragile: a large leading eigenvalue lowers the spreading threshold. Interventions that remove random nodes may do little, while targeted reduction of high-leverage nodes or edges can shift the effective spectral radius.
3. Temporal Networks and Causal Paths
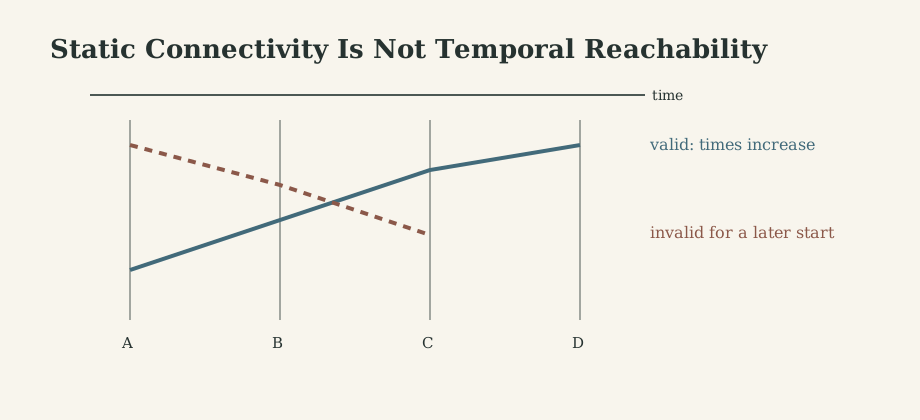
Static graphs can lie about causality. A temporal network records events:
\[\mathcal{E}=\{(i,j,t_k)\}_{k=1}^{M}.\]A path is valid only if contact times are nondecreasing:
\[t_1\le t_2\le \cdots \le t_r.\]This matters in mobile robotics, contact tracing, communication systems, and social platforms. Two nodes may be connected in the aggregate graph but unreachable in time-respecting order. Temporal metrics therefore include earliest arrival, latency, temporal reachability, and time-respecting betweenness.
4. Centrality, Communities, and Roles
Centrality is not one concept. Degree counts local exposure. Betweenness measures path brokerage:
\[C_B(i)=\sum_{s\ne i\ne t}\frac{\sigma_{st}(i)}{\sigma_{st}}.\]Eigenvector centrality rewards connection to central nodes:
\[Ax=\lambda_1x.\]PageRank adds random restarts:
\[\pi=\alpha P^\top\pi+(1-\alpha)v.\]Communities capture mesoscale structure. Modularity compares within-community edges to a configuration-model baseline:
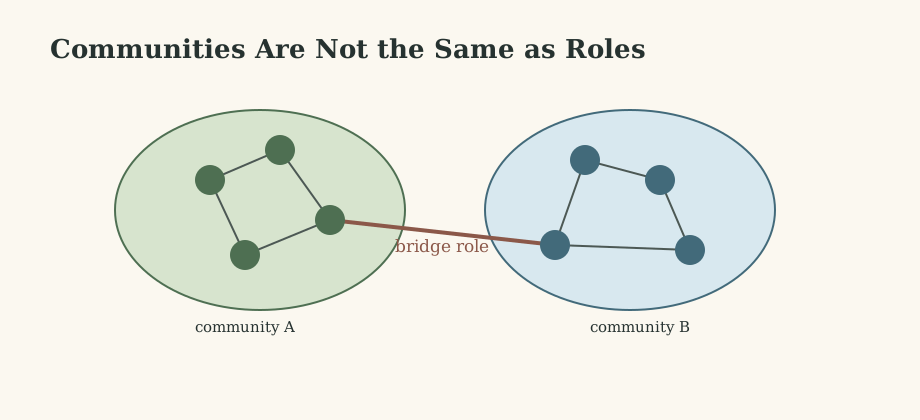
\[Q=\frac{1}{2m}\sum_{ij}\left(A_{ij}-\frac{k_ik_j}{2m}\right)\mathbf{1}[c_i=c_j].\]Louvain-style heuristics greedily improve modularity and then aggregate communities into supernodes. They are fast and useful, but high modularity is not proof of ground truth; modularity has resolution limits.
Roles and positions ask a different question. A bridge node, relay robot, broker, peripheral sensor, or hub can be functionally similar to another node even if they are in different communities.
5. Inference, Random Graphs, and Detectability
Network claims need baselines. Random graph models ask whether an observed pattern is surprising under a null mechanism. Stochastic block models provide an inferential alternative to modularity:
\[p(z,\Theta\mid G)\propto p(G\mid z,\Theta)p(z)p(\Theta).\]Bayesian evidence
\[p(G\mid\mathcal{M})=\int p(G\mid\Theta,\mathcal{M})p(\Theta\mid\mathcal{M})d\Theta\]helps compare model classes while penalizing unnecessary complexity.
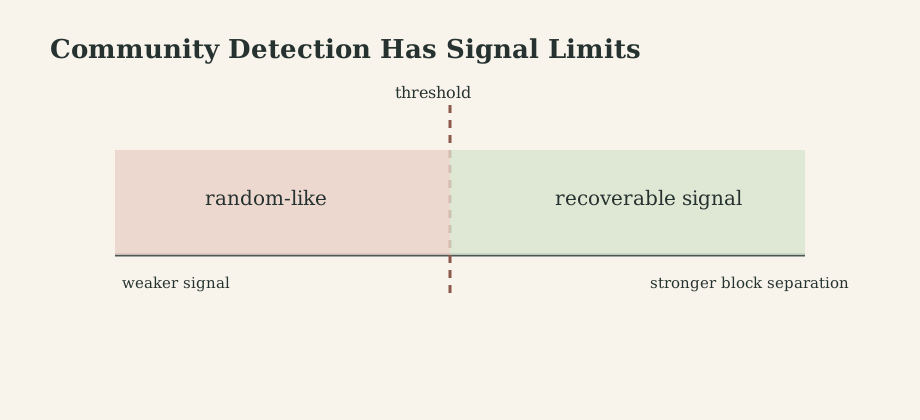
Sparse community detection also has detectability limits. In some regimes, no algorithm can recover labels better than chance asymptotically. That fact is humbling and useful: failure to recover communities may reflect insufficient signal, not a weak algorithm.
6. Network Science for Multi-Robot and Multi-Agent Systems
Multi-robot systems naturally form temporal, spatial, and communication networks. The graph determines what agents can sense, share, coordinate, or corrupt.
Useful mappings include:
- communication resilience through algebraic connectivity $\lambda_2(L)$,
- misinformation or fault spread through SIS/SIR-like processes,
- relay selection through centrality and bridge roles,
- task decomposition through communities or blocks,
- decentralized planning under partial network observability.
When agents make strategic decisions, the graph becomes adaptive:
\[\max_{a_i\in\mathcal{A}_i} U_i(a_i,a_{-i},G)-\lambda_i\operatorname{risk}_i(a_i,G).\]This creates a bridge to game theory, control, and reinforcement learning on networks.
What This Framework Lets Us Do
Network science gives tools for explaining propagation, ranking, clustering, robustness, temporal causality, and multi-agent coordination from relational structure rather than only individual features.
Where the Framework Stops Being Reliable
Many graph metrics are model-dependent. Missing edges, temporal aggregation, sampling bias, multiplex relationships, and strategic behavior can change conclusions. A network visualization is not evidence by itself; it needs a generative or mechanistic interpretation.
Where the Subject Leads Next
The natural next steps are graph representation learning, causal network inference, temporal point processes, epidemic control, distributed control, and network games.
Technical and Editorial Audit
- Reorganized the original working reference into a causal path: topology, spreading, temporal causality, centrality/community/roles, inference, and multi-agent applications.
- Replaced old
/files/network/...image references with local original SVG figures underassets/img/posts/network-science/. - Kept the core equations for SIS threshold, centrality, PageRank, modularity, Bayesian evidence, and decision-coupled networks.
- Marked course attribution honestly as personal synthesis because no source course code was present in the file.
- Claims about detectability and inference are conceptual summaries; detailed thresholds depend on model assumptions.
Main Sources Used in This Note
- M. E. J. Newman, Networks.
- A.-L. Barabasi, Network Science.
- S. Fortunato, “Community detection in graphs.”
- P. Van Mieghem, Performance Analysis of Complex Networks and Systems.
- R. Olfati-Saber, J. A. Fax, and R. M. Murray, “Consensus and Cooperation in Networked Multi-Agent Systems.”