Operations Management of Production and Service Systems
This note is adapted from course materials for SEEM4106 Operations Management of Production and Service Systems at City University of Hong Kong. Instructor: course teaching staff.
Central Question
How do throughput, WIP, cycle time, capacity, variability, service level, and quality constrain one another in production and service systems?
Operations management is the physics of organized work. Parts, patients, tickets, calls, wafers, and orders all move through stations, queues, routing rules, and information systems.
\[\text{arrival demand} \rightarrow \text{queue} \rightarrow \text{capacity} \rightarrow \text{departure} \rightarrow \text{feedback and control}.\]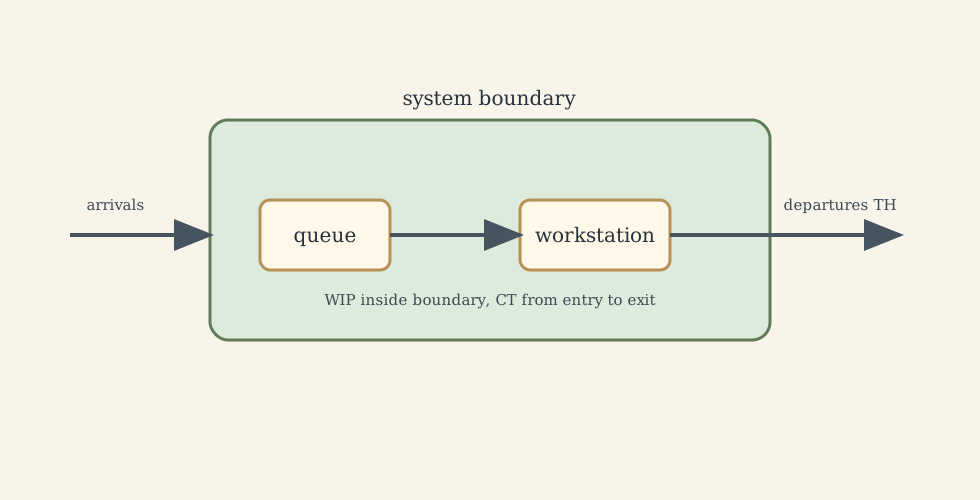
1. Flow Variables
Core variables:
- throughput (TH): long-run completion rate;
- WIP: work in process inside the system boundary;
- cycle time (CT): elapsed time from entry to exit;
- utilization (\rho): fraction of effective capacity consumed;
- bottleneck: resource with the smallest effective capacity;
- service level: probability of meeting a time, fill, or response target.
Little’s Law is the central identity:
\[WIP = TH \cdot CT.\]It applies to stable systems with consistent boundaries and long-run averages. It does not say lowering WIP automatically preserves throughput. If variability is unchanged, cutting WIP too aggressively can starve the bottleneck and reduce output.
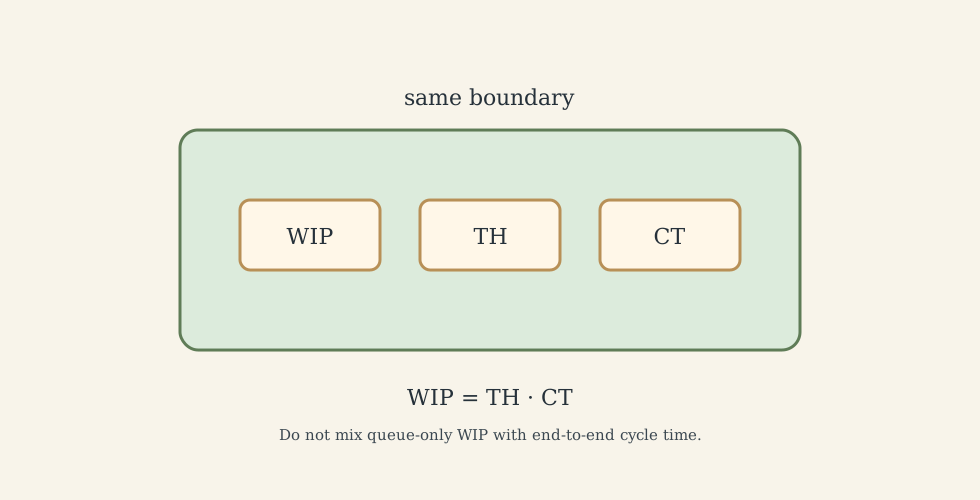
Example: if a line ships (180) units/day with (135) units WIP,
\[CT=\frac{135}{180}=0.75\ \text{day}.\]To keep throughput and reduce (CT) to (0.50) day, target WIP is
\[WIP=180\times0.50=90.\]That target is safe only if variability and release control support it.
2. Queues, Utilization, and Variability
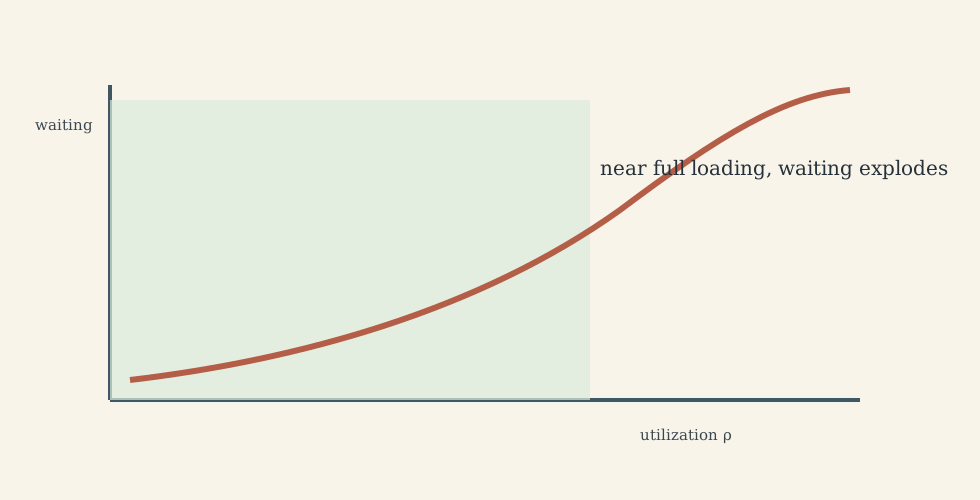
Waiting appears when random arrivals meet finite capacity. For one server,
\[\rho=\frac{\lambda}{\mu},\]where (\lambda) is arrival rate and (\mu) is service rate.
The M/M/1 average waiting-time pattern contains the main lesson:
\[W_q=\frac{\rho}{\mu(1-\rho)}.\]As (\rho\to1), waiting grows nonlinearly. High utilization is efficient only if variability is low or buffers and service promises are designed for it.
Variability comes from:
- bursty arrivals;
- variable processing times;
- breakdowns and setups;
- rework loops;
- batching;
- routing differences;
- priority interruptions.
The managerial implication is blunt: if you want short cycle time at high utilization, you must reduce variability or add capacity/buffer.
3. Bottlenecks and System Throughput
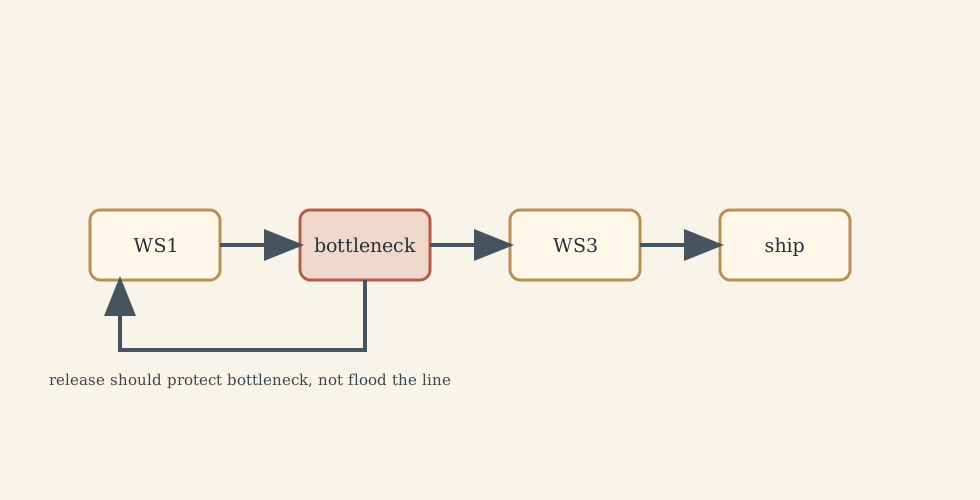
Local efficiency is not system performance. A non-bottleneck working faster can create more WIP without increasing throughput.
If station capacities are (r_i), the bottleneck rate is
\[r_b=\min_i r_i.\]Long-run throughput cannot exceed the effective bottleneck rate after losses, downtime, quality defects, and blocking/starvation.
Improvement order:
- identify the true bottleneck;
- keep it supplied with good work;
- remove avoidable downtime and setup loss;
- subordinate upstream release to bottleneck capacity;
- add capacity only after process losses are understood.
4. Push, Pull, MRP, JIT, Kanban, and Lean
MRP is push planning: forecasts, bills of material, and schedules coordinate future material availability. It is useful for planning but sensitive to forecast error and schedule nervousness.
Kanban is pull execution: downstream consumption authorizes upstream replenishment. It makes WIP limits explicit.
JIT reduces excess inventory and exposes root causes such as long setup times, unreliable equipment, quality instability, and supplier variation.
Lean is broader: flow, waste reduction, standardized work, quality at source, and continuous improvement.
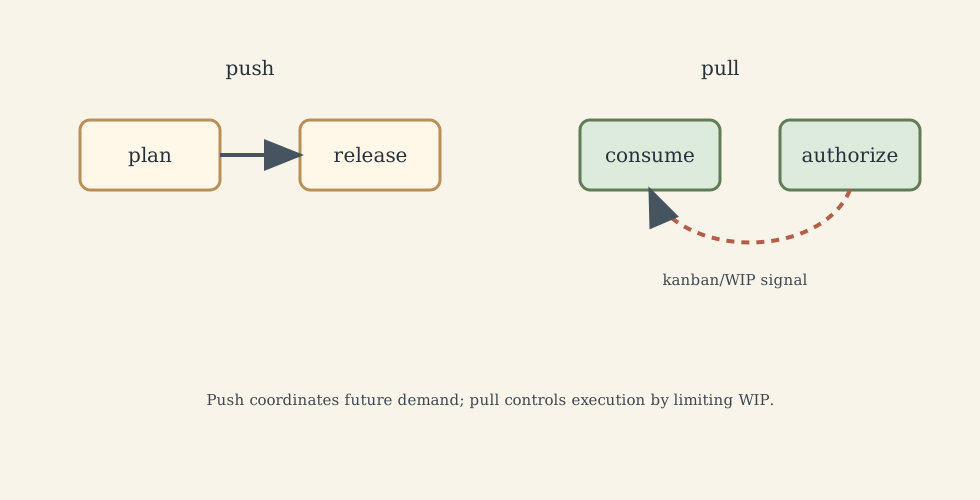
Hybrid systems are common: push planning for medium-term coordination and pull execution near the shop floor where variability is observed.
5. Quality and Flow Are Coupled
Defects are not only quality problems. They are flow problems. Rework loops increase WIP, consume capacity, lengthen cycle time, and hide the true bottleneck.
Quality at source means preventing defective work from moving downstream. Inspection-only quality can sort defects, but it cannot recover lost capacity or time.
Useful questions:
- where is rework entering the flow?
- does the bottleneck process good units or defects?
- are queues hiding quality feedback?
- does batching delay detection?
- are service failures caused by capacity shortage or process variability?
6. Improvement Logic
Operations improvement is not slogan selection. It is diagnosis:
- if cycle time is high, inspect WIP and variability;
- if throughput is low, inspect bottleneck capacity and starvation/blocking;
- if service level is poor, inspect arrival variability, priority rules, and capacity buffer;
- if cost is high, inspect rework, setups, inventory, and idle imbalance;
- if lean/JIT fails, inspect whether variability was reduced before inventory was removed.
The best operational systems use measurement as feedback, not decoration.
What This Framework Lets Us Do
It lets us connect factory and service behavior through the same flow laws: Little’s Law, queueing, bottlenecks, variability, WIP control, quality feedback, and service-level design.
Where the Framework Stops Being Reliable
Simple formulas fail when boundaries are inconsistent, arrivals are nonstationary, priorities dominate, human behavior changes under load, rework is hidden, or service value cannot be reduced to average time.
Where the Subject Leads Next
Operations management leads to factory physics, supply-chain management, stochastic modelling, simulation, scheduling, reliability, quality engineering, and service-system design.
Technical and Editorial Audit
| Area | Correction or decision |
|---|---|
| Central question | Reframed operations around flow constraints and feedback control. |
| Preserved material | Kept Little’s Law, utilization, bottlenecks, queueing, MRP/JIT/Kanban/Lean, service systems, and quality coupling. |
| Equations | Kept (WIP=TH\cdot CT), utilization, bottleneck rate, and M/M/1 waiting relation. |
| Figures | Added five original SVG diagrams for flow boundary, Little’s Law, utilization waiting, bottleneck logic, and push/pull control. |
| Main correction | Emphasized boundary discipline and variability before inventory reduction. |
Main Sources Used in This Note
- CityU SEEM4106 course material.