Risk and Safety Notes
This note is adapted from course materials for GE1318 Are We Safe?: Risks in Our Everyday Life at City University of Hong Kong. Instructor: course teaching staff.
Central Question
How do we reason about safety when hazards cannot always be removed, exposure changes over time, humans and organizations make mistakes, and public perception may not match measured risk?
Safety does not usually mean zero danger. It means hazards have been identified, exposure has been controlled, consequences have been limited, and the remaining risk is judged acceptable or tolerable for the situation. That judgment is technical, social, legal, and ethical at the same time.
The causal spine is:
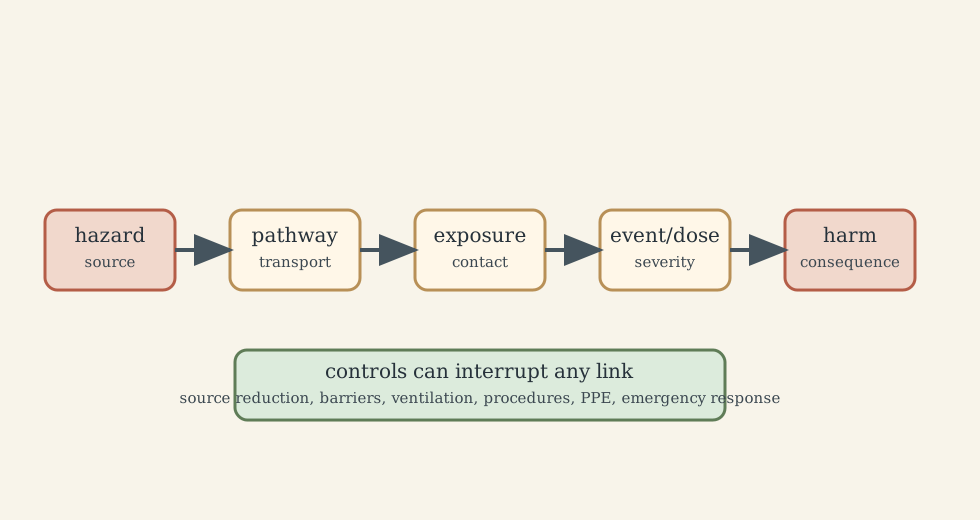
\[\text{hazard} \rightarrow \text{exposure pathway} \rightarrow \text{dose or event} \rightarrow \text{harm} \rightarrow \text{controls} \rightarrow \text{monitoring} \rightarrow \text{learning and revision}.\]This note treats risk as a system property, not only as a number. A chemical, a fire, a high-rise building, a construction site, or a nuclear facility becomes dangerous through a chain of mechanisms: source strength, pathway, exposure, vulnerability, failure of barriers, and delayed response.
1. Hazard, Exposure, Risk, and Safety
A hazard is a source or situation with potential to cause harm. Exposure is contact between the hazard and a person, asset, environment, or system. Risk combines the possibility of harm with the severity of harm. Safety is the condition where risk is controlled to an acceptable level.
The familiar first model is
\[\text{Risk} = \text{Likelihood} \times \text{Consequence}.\]This is a useful ranking model, not a universal physical law. It works best when likelihood and consequence can be estimated consistently. It becomes weaker when events are rare, consequences are catastrophic, uncertainty is high, or social trust is low.
For exposure problems, a more mechanistic view is often better:
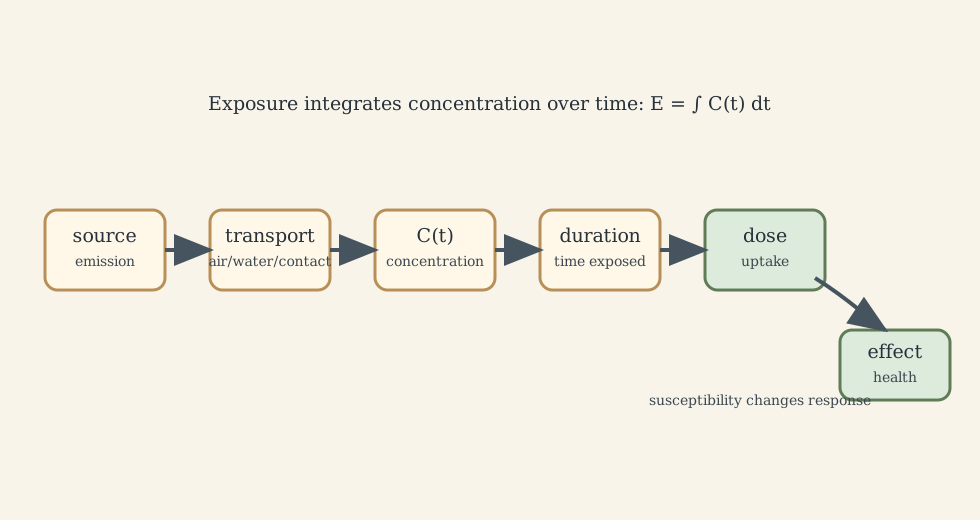
\[\text{Exposure} \approx \text{Concentration} \times \text{Duration},\]or, when concentration varies with time,
\[E=\int_{t_1}^{t_2} C(t)\,dt,\]where (E) is exposure over the interval and (C(t)) is concentration. Units depend on the contaminant, for example (\mathrm{mg\,h/m^3}) for airborne concentration integrated over time.
The control logic follows directly: reduce source strength, interrupt the pathway, shorten duration, lower concentration, protect the person, or reduce consequence after exposure.
2. Risk Perception and Risk Communication
Measured risk and perceived risk often diverge. People react strongly to risks that are unfamiliar, involuntary, invisible, catastrophic, delayed, unfairly distributed, or controlled by institutions they do not trust. Familiar daily risks can be underestimated because repeated exposure feels like evidence of safety.
This does not mean public concern is irrational noise. Perception often carries information that formal calculations omit: dread, fairness, consent, reversibility, institutional trust, and historical experience. Good risk communication therefore does two things at once:
- explains measured likelihood, consequence, exposure, and uncertainty;
- acknowledges values, control, fairness, and trust.
The worst communication pattern is false reassurance. The second worst is technical precision without context. A useful message says what is known, what is uncertain, what action is being taken, and what would trigger a change in advice.
3. Risk Assessment as a Process
Risk assessment is not a list of worries. It is a repeatable process. ISO 31000 frames risk management around establishing context, identifying risks, analyzing risks, evaluating risks, treating risks, and then monitoring, reviewing, recording, reporting, communicating, and consulting.
A practical engineering workflow is:
- define the system boundary and protected targets;
- identify hazards and credible exposure pathways;
- estimate likelihood, exposure, vulnerability, and consequence;
- rank or quantify risk;
- select controls using a hierarchy of effectiveness;
- verify that controls work;
- monitor drift and revise when conditions change.
Risk matrices can help early prioritization, but they compress uncertainty. A “medium” cell can hide a frequent minor event or a rare severe event. Quantitative analysis becomes more important when legal limits, catastrophic consequences, public communication, or design tradeoffs depend on numbers.
4. Controls: Prevention, Protection, Containment
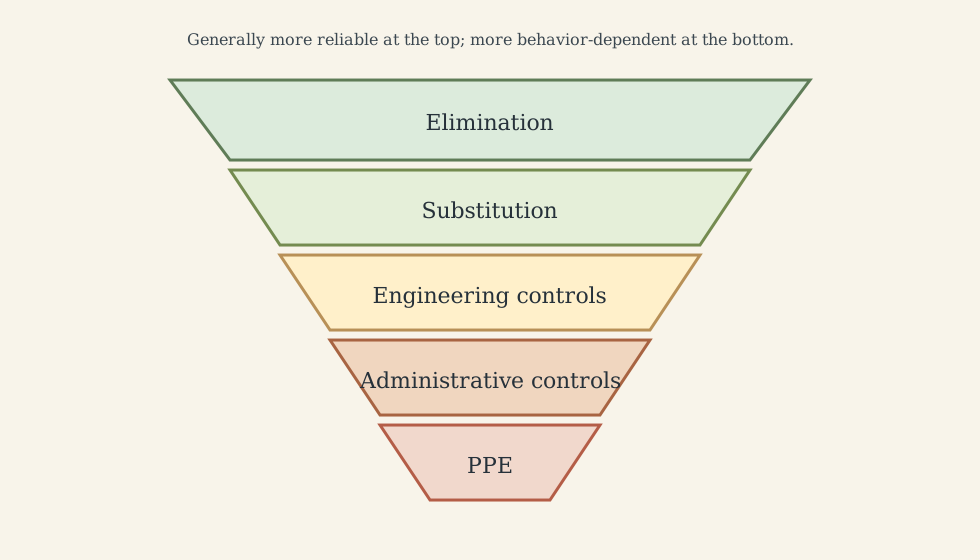
The course material groups mitigation into prevention, protection, and containment. Occupational safety often expresses the same idea as the hierarchy of controls: eliminate the hazard if possible, substitute a safer option, use engineering controls, add administrative controls, and rely on PPE last.
Examples:
- eliminate: avoid a hazardous process entirely;
- substitute: use a lower-toxicity material;
- engineering control: enclosure, ventilation, interlock, guard, smoke compartment;
- administrative control: procedure, permit, training, scheduling, signage;
- PPE: respirator, gloves, hearing protection, eye protection.
PPE is necessary in many settings, but it is a weak final barrier if the upstream system is poorly designed. Good safety design tries to make the safe action easy and the dangerous action difficult.
5. Barriers, Bow-Ties, and Accident Causation
Accidents usually require a chain of failed controls. A bow-tie model is useful because it separates preventive barriers from mitigating barriers.
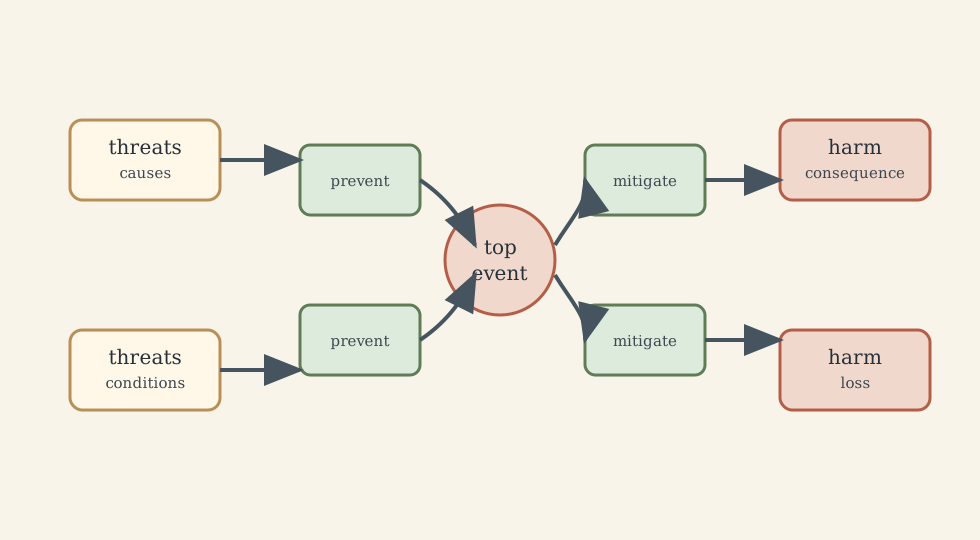
The middle of the bow-tie is the top event, such as loss of containment, ignition, fall, overdose, or smoke spread. On the left are threats and preventive barriers. On the right are consequences and mitigation barriers.
This view helps avoid a common mistake: blaming only the last person near the accident. Human error matters, but it often occurs inside latent organizational conditions:
- unclear responsibility;
- weak training;
- production pressure;
- poor maintenance;
- confusing interfaces;
- missing feedback;
- normalization of deviance;
- ineffective supervision.
Active failures are close to the event. Latent failures sit upstream in design, management, procurement, staffing, and culture. Strong safety systems search for both.
6. Exposure Risk and Environmental Health
Many risks are chronic rather than sudden. Air pollution, noise, heat stress, poor ventilation, and biological contamination harm through duration, pathway, susceptibility, and dose.
Indoor air quality is not only about avoiding acute illness. It affects health, comfort, and productivity. Important pollutants or stressors include:
- carbon monoxide, which interferes with oxygen transport;
- ozone and nitrogen dioxide, which can irritate the respiratory system;
- sulphur dioxide, especially for sensitive groups;
- volatile organic compounds;
- particulates and construction dust;
- biological hazards such as Legionella in water systems;
- heat, humidity, and ventilation problems.
Outdoor air risk adds atmospheric transport, roadside emissions, regional pollution, weather, and policy thresholds. Standards and air-quality objectives matter because they turn scientific evidence and public-health judgment into enforceable or advisory limits. Those limits should not be treated as magic boundaries between safe and unsafe; risk often changes continuously with dose and vulnerability.
7. Nuclear Safety and Low-Probability High-Consequence Risk
Nuclear safety is difficult to discuss because radiation is invisible, technically complex, and associated with severe historical accidents. Public fear can be high even when measured dose is low; technical reassurance can fail if trust is low.
A clear nuclear-risk discussion must separate:
- radioactive material or radiation source;
- exposure pathway;
- absorbed or effective dose;
- duration and population affected;
- measurement uncertainty;
- engineered containment;
- emergency response and communication.
The lesson is not that nuclear risk is always small or always catastrophic. The lesson is that risk communication must link the hazard source to actual exposure and dose while being honest about uncertainty, monitoring, and protective action.
8. High-Rise Fire Safety
High-rise fire safety is not ordinary fire safety stretched vertically. Dense occupancy, long egress paths, mixed uses, smoke movement, stack effect, firefighting access, and occupant behavior make it a coupled building-system problem.
The key time comparison is:
\[ASET > RSET,\]where ASET is available safe egress time before conditions become untenable, and RSET is required safe egress time for occupants to reach safety.
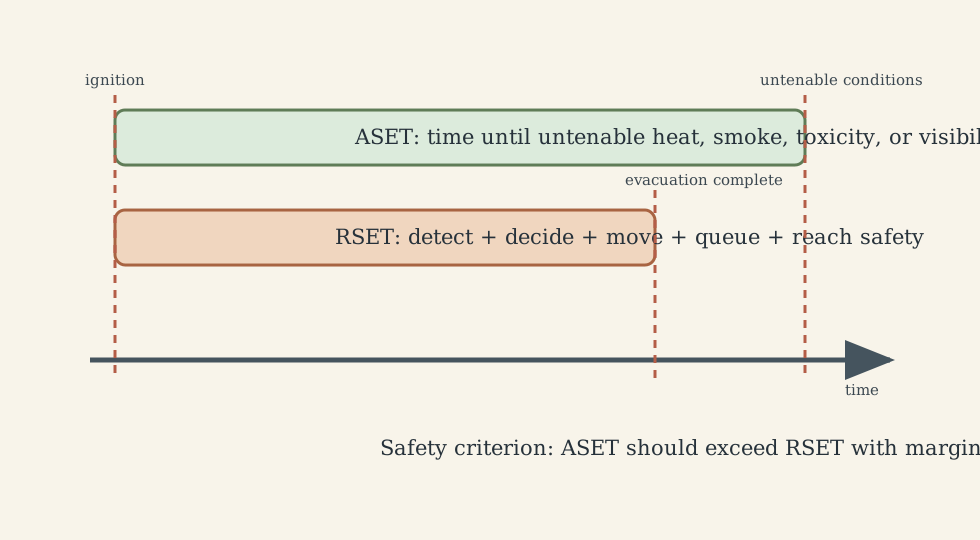
RSET includes detection, alarm, recognition, pre-movement delay, travel time, queuing, and assistance for people with limited mobility. ASET depends on fire growth, smoke layer descent, toxicity, heat, visibility, compartmentation, suppression, and smoke control.
Refuge floors, common in tall-building strategies such as those discussed in Hong Kong contexts, are not automatically safe spaces. They require fire separation, smoke protection, ventilation, sufficient area, clear wayfinding, and management procedures. A refuge floor is a barrier in the system, and like any barrier, it can fail if assumptions are wrong.
The NFPA Fire & Life Safety Ecosystem is useful here because it reminds us that codes, referenced standards, competent workforce, enforcement, preparedness, and informed occupants all have to work together. A building is not safe because one component exists; it is safer when the ecosystem functions.
9. Campus Case Study: Construction Near Occupied Spaces
The CityU project example is useful because it is ordinary and therefore realistic. Construction near study and dining spaces can create dust, noise, access disruption, stress, and reduced comfort. These are not dramatic disaster scenarios, but they affect daily health, attention, and trust.
The earlier slide claim of noise greater than 120 dB should be treated as a project observation requiring instrument validation. The correct engineering response is not to repeat the number confidently; it is to specify measurement method, location, duration, calibration, and comparison criterion.
A practical mitigation package would include:
- wet suppression or local exhaust for dust;
- barriers and pressure control where feasible;
- scheduling of high-noise work away from exams or peak occupancy;
- noise and particulate monitoring;
- clear signage and alternate routes;
- complaint channels with response times;
- feedback review after controls are installed.
This example shows that risk management is a feedback loop. Controls must be observed, not merely announced.
10. Monitoring, Learning, and Safety Culture
A safety system must learn. If incident reports, near misses, complaints, maintenance logs, inspection findings, and health data do not change future decisions, the system is only documenting risk rather than managing it.
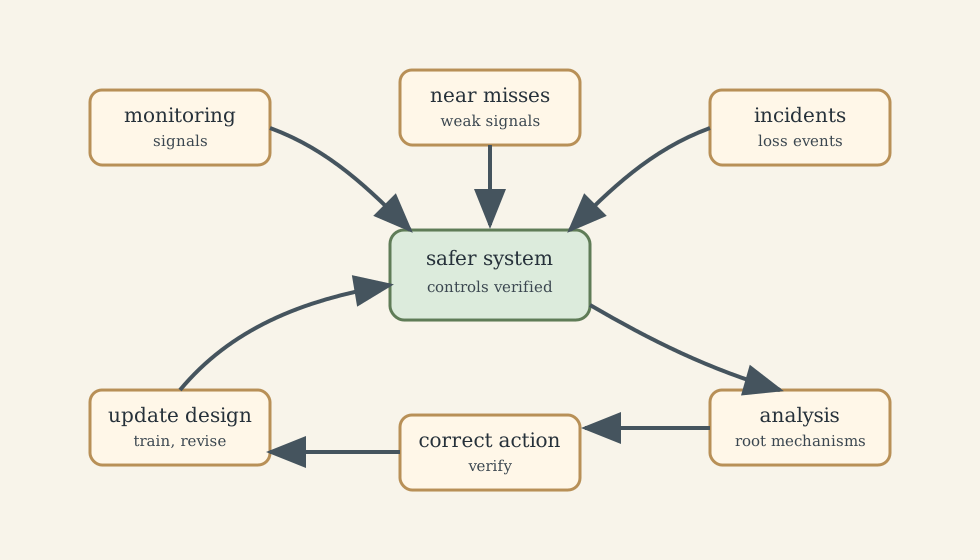
Good safety culture is not “people are careful.” It is a system in which people can report weak signals, managers respond before harm occurs, procedures match real work, and controls are verified. Useful indicators include:
- near-miss reporting quality;
- corrective-action closure and verification;
- maintenance backlog;
- training matched to actual tasks;
- audit findings that lead to design or process changes;
- worker ability to stop unsafe work without retaliation.
Safety culture fails when risk is normalized because “nothing bad happened last time.”
What This Framework Lets Us Do
This framework lets us analyze everyday and engineering risks without reducing safety to slogans. It asks:
- what is the hazard source?
- who or what is exposed?
- through what pathway?
- what dose, event, or condition creates harm?
- what barriers prevent the event?
- what barriers reduce the consequence?
- how do we monitor whether assumptions remain true?
- how do we communicate uncertainty without hiding it?
Where the Framework Stops Being Reliable
Simple risk equations become unreliable when data are sparse, consequences are extreme, uncertainty is deep, human behavior dominates, or social trust is damaged. In those cases, formal analysis still helps, but it must be paired with conservative design, transparent communication, stakeholder involvement, and ongoing monitoring.
Where the Subject Leads Next
Risk and safety connect directly to manufacturing quality, control systems, robotics, software reliability, environmental engineering, biomedical design, building systems, and engineering ethics. The later question is not only “how likely is failure?” but “who bears the risk, who benefits, who decides, and how quickly can the system learn?”
Compact Recall Map
- Hazard is potential harm; risk requires exposure and consequence.
- Safety means controlled risk, not zero risk.
- Exposure depends on concentration, pathway, duration, uptake, and vulnerability.
- Controls should be selected by effectiveness, not convenience.
- PPE is usually the last line of defense, not the design goal.
- Accidents often combine active failures with latent organizational weaknesses.
- Fire safety requires ASET greater than RSET with margin.
- Risk perception includes trust, control, fairness, and dread.
- Monitoring and near-miss learning are part of risk control.
- Safety is a living system that must revise itself when conditions change.
Technical and Editorial Audit
| Area | Correction or decision |
|---|---|
| Central question | Reframed the note around hazard-to-harm causality, exposure pathways, controls, communication, and learning. |
| Equations | Kept likelihood-consequence risk, exposure approximation, exposure integral, and ASET/RSET comparison; clarified assumptions and units. |
| Terminology | Distinguished hazard, exposure, dose, risk, safety, preventive barrier, mitigating barrier, ASET, RSET, active failure, and latent failure. |
| Claims requiring care | Marked the campus noise value as a project claim requiring instrument validation. |
| Figures | Added six original SVG diagrams for hazard chain, hierarchy of controls, bow-tie barriers, exposure pathway, ASET/RSET, and safety learning. |
| External verification | Added current anchor references for ISO 31000, NIOSH/CDC hierarchy of controls, OSHA hierarchy guidance, and NFPA fire/life-safety ecosystem. |
Sources and Further Reading
- ISO 31000:2018 Risk management guidelines: https://www.iso.org/standard/65694.html
- CDC/NIOSH hierarchy of controls: https://www.cdc.gov/niosh/hierarchy-of-controls/about/index.html
- OSHA hierarchy of controls worksheet: https://www.osha.gov/sites/default/files/Hierarchy_of_Controls_02.01.23_form_508_2.pdf
- NFPA Fire and Life Safety Ecosystem: https://www.nfpa.org/about-nfpa/nfpa-fire-and-life-safety-ecosystem
- CityU GE1318 course material.